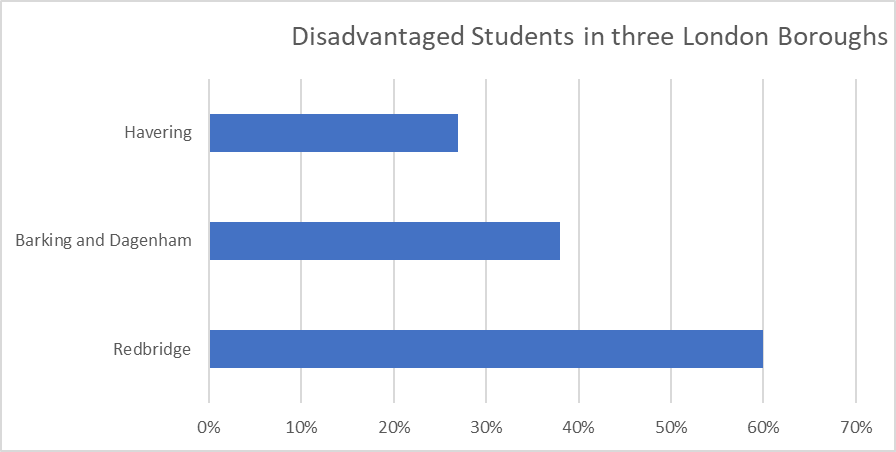
Havering’s GCSE Attainment Gap, 2023

GCSE Grade 5 English and Maths is as crucial for disadvantaged students as for all other youngsters. Unfortunately, disadvantaged students do so badly in some schools, it’s as if they’re victims of a conspiracy.1

The Gold Standard for GCSE is ‘Grade 5 English and Maths’. This is the benchmark used to define the attainment gap. It’s ‘Gold’ because it impacts on post-16 opportunities where success is a game changer. Regardless of the excellence of other GCSE results students must have Grade 5 English and Maths to progress to ‘A’ level for example.


St Edwards is the only Havering school with a level playing field for disadvantaged students.

The Human Cost

In 2023, 653 disadvantaged students sat GCSE. The national success result for all students is 45.3%.2 This benchmark means 295 disadvantaged students should have achieved the Gold Standard in Havering. Their actual results are 175 Gold Standard passes (27%). 120 students were denied many post-16 opportunities because their school didn’t level-up the achievement gap by using government funds efficiently.

(If St Edwards is used as the benchmark, Havering’s attainment gap increases to 151 students.)

Government funding for disadvantaged students

Schools with disadvantaged students receive £1,035 per student Pupil Premium (PP) funding. ‘Disadvantaged’ means receiving ‘Free School Meals’ or being ‘Looked After’. The money is paid directly to schools as they’re trusted to use the funds wisely and ‘level-up’ achievement.3 The minimum the government paid Havering’s 18 schools for Year 11s, 2022-3, is £678,249. Most of that funding wasn’t used efficiently as can be seen from the table above.

The Attainment Gap: Marshalls Park and Emerson Park

Both schools achieved 45% ’Gold Standard’ results for students in general but utterly failed disadvantaged students with a ‘success’ rate of 16% and 17% respectively.  

  • Emerson Park don’t publish exam results but state, “Emerson Park Academy is, once again, celebrating an outstanding set of GCSE results.” (my emphasis)
  • Marshalls Park don’t publish their results either. They say, “We believe that we provide an academic education, that is grounded in strong literacy and numeracy….” (my emphasis)3

The government’s PP funding stream for Year 11 disadvantaged students is £46,575 for Marshalls Park and £48,645 for Emerson Park. Neither the government or Year 11 disadvantaged students got ‘value-for-money’. It’s clear PP funding isn’t used to the best effect. Both schools have strategies which need an urgent revisit with external experts.

The Attainment Gap: OFSTED

The attainment gap is not discussed in OFSTED reports nor is the use of Pupil Premium funding.4

Notes

1 The-Forgotten-Third-Interim-Report-March-2019.pdf (ascl.org.uk) This research focuses on Grade 4 and is less than what is used for this discussion. Grade 4 is an entry level qualification and is discounted for ‘A’ level courses.

2 Key stage 4 performance, Academic year 2022/23 – Explore education statistics – GOV.UK (explore-education-statistics.service.gov.uk)

3 Emerson Park Academy – A message from Mr McGuinness regarding GCSE Results This relates to 2022 there is nothing for 2023 even though the data was accessed February 2024. See also Marshalls (marshallspark.org.uk)

4 Marshalls Park 50148108 (ofsted.gov.uk) See also Emerson Park 50193985 (ofsted.gov.uk)


.


Why isn’t there a Standard Format for the publication of GCSE results?

Havering doesn’t have a standard format for publishing GCSE results.1 As a result they’re difficult to interpret. Havering’s schools aren’t alone;

Woodford County High, Redbridge2

No of Year 11 pupils 178
No of GCSE entries 1754
% of levels 9 – 7 (equivalent to A*+ A Grades ) 80%
% of levels 9 32%
% of pupils achieving 5+ levels 9-5 100%
% of pupils achieving 5+A*-C levels 9-5 including English & Maths 99%
% of students attaining English Baccalaureate 97%

There’s little detail – does the school have any weak subject areas? – but what is published is intelligible.

Hornchurch High School3

This school offers time-lapsed results from 2022, even though the 2023 results came out in late August ’23.

Performance Measure
Progress 8 Score -0.42
Attainment 8 Score 45.4
% pupils achieving a grade 5 or above in GCSE English and maths 40
% pupils entering the English Baccalaureate (EBacc) 72
English Baccalaureate Average Points Score 4.22
% of pupils staying in education or employment after KS4 88

Who this set of statistics is for is unclear. Current information can be found on the government website4 – which the school identifies. That website is full of statistical detail, which might not suit everyone.

Abbs Cross Academy5
They offer 2023 results without mentioning subject areas beyond an English and Maths analysis. They offer a link to the government’s website for a league table.6 (They are average.)

Sacred Heart of Mary
Meanwhile Havering’s top performing school,7 shows what should done and provides a template for every school in Havering. Every subject is listed with the outcomes and the number of pupils who sat each examination.

Conclusion

There’s no acceptable explanation why Havering’s schools conceal examination results from parents and taxpayers. Last year this blog wrote about the same issue and ONE school immediately took action. Schools should understand that the publication of results is in their interests. This is especially the case in an era of conspiracy theorists.

Notes

1 How Havering’s Academies Conceal their 2022 GCSE Results – Politics in Havering

2 Woodford County High School For Girls – 2023 Exam Results

3 Hornchurch High School » EXAMINATION PERFORMANCE, 2021-22

4 Secondary – Hornchurch High School – Compare school and college performance data in England – GOV.UK (compare-school-performance.service.gov.uk)

5 Achievement And Performance – Abbs Cross Academy The school’s analysis of English and Maths is very technical and beyond most non-educator’s understanding. Effectively it’s meaningless for most parents.

6 All schools and colleges in Havering – Compare school and college performance data in England – GOV.UK (compare-school-performance.service.gov.uk)

7 GCSE-RESULTS-SUMMER-2023-v3.pdf (realsmart.co.uk)