Havering’s Unaccountable Secondary Academies, 2026

Every Havering’s academy prepares students for GCSE. Because academies are unaccountable they give as much, or as little, information as they wish. They are in receipt of millions of pounds of public money but treat every stakeholder as a nuisance. This is an undemocratic outrage and Havering Council is helpless unless they use their position as influencers to change this situation.

A paradigm of how GCSE results should be presented1

Coopers Coburn Results Booklet 2026

Harris Academy Rainham Our Results – Harris Academy Rainham

Redden Court Redden Court School – Examination Information and Results

Royal Liberty The Royal Liberty School – Examination Results

Sacred Heart of Mary Binder1.pdf

GCSE results presented as an overview without detail2

Bower Park Bower Park Academy: GCSE Results, Ofsted & Reviews (2026) | LocaleIQ

Emerson Park Emerson Park Academy: GCSE Results, Ofsted & Reviews (2026) | LocaleIQ

Gaynes Gaynes School: GCSE Results, Ofsted & Reviews (2026) | LocaleIQ

Hall Mead Hall Mead School: Outstanding Ofsted, Results… (2026) | LocaleIQ

Hornchurch High Hornchurch High School: GCSE Results, Ofsted… (2026) | LocaleIQ

Marshalls Park Marshalls Park Academy: GCSE Results, Ofsted… (2026) | LocaleIQ

Swamped by virtually incomprehensible detail3

Abbs Cross Achievement And Performance – Abbs Cross Academy

GCSEs as a version of the Olympic Games4

Drapers’ GCSE Results 2026 – Latest News – Drapers’ Academy

Sanders Draper Sanders Draper – Examination results

St Edward’s GCSE students celebrate impressive results at St Edward’s Academy | St Edward’s Church of England Academy

Fluffy PR boosterism5

Frances Bardsley GCSE Results 2026 – The Frances Bardsley Academy For Girls The Frances Bardsley Academy For Girls

Ignorance is bliss: There is no data at all on these websites6

Brittons Exam Results – The Brittons Academy

Campion Our Results – The Campion School

Research Note

The research for this was done on the 29th and 30th of September 2026

Notes

1 These five schools display their results in a clear and informative way.

2 These six schools present their results in an odd way. Basically, you need prior knowledge to able to use the information.

3 This school has a page of statistical detail which only an educational professional could use.

4 These three schools focus entirely on their Super Achievers.

5 This school uses gushing prose to present their GCSE results without any detail at all.

6 These two schools are outrageous. It is as if they are covering-up a disaster, which in Campion’s case is absolutely not true.
School Ties and the Cost-of-Living Crisis

Introduction

Drapers: tie compulsory £4.50 ~ Drapers’ Academy – Smarty Pants Schoolwear

Harris Academy, Rainham: tie compulsory for boys (not girls) £7:95 ~ Harris Academy Rainham – Khalsa Schoolwear

Sacred Heart Of Mary: tie compulsory £10 ~ Sacred Heart of Mary Girls’ School – SchoolSports4U

Discussion

Making school ties compulsory emphasises their necessity. ‘Compulsory’ school ties, implies there are no circumstances when they stop being essential.

Two of Havering’s academies don’t understand this. Harris Academy Rainham has a school tie policy, which makes them compulsory for male students.1 Obviously this means female students, in the same classrooms and following the same learning activities, are treated significantly differently. The benefits bestowed by a school tie are non-essential for females because they’re females.

At Sacred Heart of Mary’s Academy, which is all female, ties are compulsory but only for six months of the year. During the hotter months ties are not worn. How the Academy discovered that weather decides when a tie is essential to education, or discipline, or the school ethos is fascinating. Just how did they do it? What scientific experiment was followed? Will they publish the data?

Does it matter? It matters a great deal because compulsory school uniform is a tax/entry fee.2 Ties must be bought yet the policies underpinning that tax/entry fee is arbitrary and inconsistent. These two schools have policies which are absurd and indefensible. Students can, and are, excluded from classrooms for ‘improper’ school uniform. The policy is ridiculous. Ridiculing it by students is a disciplinary breach and is fiercely punished. Academies are trapped in an historic time-warp.

School attendance is compulsory and wearing school uniform is a necessary part of attendance. Obeying the law obliges parents/guardians to buy the designated uniform. Many items have to be bought from a specified shop (see Introduction). The cost of school uniforms is controversial.2 As can be seen from the introduction, there are considerable differences in cost on even basic items like the school tie. The Drapers’ Academy tie is less than half that of the Sacred Heart of Mary3 with the Harris Academy Rainham at a sort-of midpoint.

Conclusion

Harris Academy Rainham relies on gender to make sense of its school tie policy. On the other hand, Sacred Heart of Mary relies on the weather. Both are indefensible. And parents/guardians have to pay. Given that Academies are places of learning you might think that policies would be intelligently reviewed. An immediate outcome would be to reduce the tax/entry fee for compulsory education.

Britain’s new Prime Minister routinely wears T-shirts in public. Andy Burnham is a vivid illustration that the world has changed and schools should ‘catch-up’. And the House of Lords have just announced that ties are no longer compulsory for male peers.5

Addendum: An overview of appropriate clothing

This is a 3-minute YouTube video I did sometime ago School ties are a tax on learning – YouTube

Notes

1 Our Uniform – Harris Academy Rainham

2 It might not be a tax as not everyone pays e.g. girls at Harris Academy Rainham

3 According to information provided by parents, the new uniform includes a £34 blazer, a £24 branded skirt, purple check shirts costing £30 for two, plain purple shirts at £28 for two and an £8.25 tie. Frances Bardsley Parents Question Rising Uniform Costs as School Defends New Uniform Under 2026 Government Rules. – The Havering Daily

4 120 students entered this school in September 2026. Parents/guardians therefore spent £1200 on ties, which are used for six months pf the years.

5 Is the tie dead? Fashion connoisseurs hope not as House of Lords relaxes rules | House of Lords | The Guardian

Havering’s Secondary Schools: Two Government Assessments

Havering’s schools have two forms of government assessment. Firstly, Progress 8 predicts GCSE results by using a statistical analysis of KS2. Schools which add value  means children will out-perform their expected grades. Secondly, OFSTED reports. They happen at multi-year intervals. Inspectors grade schools using five headings, (1) Overall effectiveness, (2) Effectiveness of leadership and management, (3) Quality of teaching, learning and assessment, (4) Personal development, behaviour and welfare and (5) Outcomes for pupils.

Progress 8

Well Above Average1

Sacred Heart of Mary, Campion and Harris Academy Rainham

Above Average

Royal Liberty, Coopers Coborn, Frances Bardsley, Hall Mead, Redden Court and Hornchurch High

Average

Gaynes, St Edward’s and Drapers’

Below Average

Abbs Cross, Emerson Park, Marshalls Park, Brittons and Sanders Draper

Well Below Average

Bower Park

OFSTED

OFSTED uses four summary categories Outstanding, Good, Requires Improvement and Inadequate. Reports aren’t annual and not necessarily current.

Outstanding

Hall Mead, Redden Court, Sacred Heart of Mary, Francis Bardsley (3 categories out of 5), and Royal Liberty (short inspection)

Good

Every other school.

Discussion

There’s no correlation between the two government assessments.

OFSTED criteria, Quality of teaching, learning and assessment and Outcomes for pupils are critical for every stakeholder using the reports.

How can a 22% GCSE Grade 5+ English and Maths pass rate for disadvantaged children at Abbs Cross2 be rewarded by a ‘Good’ assessment. OFSTED say, Trustees, leaders and staff have high expectations for all pupils, including those with special educational needs and/or disabilities (SEND). (my emphasis). ‘High expectations’ in this context is overblown.

Likewise, Marshalls Park. 42.1% non-disadvantaged children passed Grade 5+ English and Maths and are rated ‘Good’. This result is 5% below the national average and 10% below the Havering comparator. Worse: disadvantaged children achieved a sickening 21.8%4 English and Maths Gold Standard pass rate at Marshalls Park.

OFSTED reports aren’t fit for purpose. Their reports lack rigour and ignore outcomes which are important to society. Progress 8 focuses on added value, whichschools create. OFSTED ignores these insights. This is a criminal dereliction of duty.

Notes

1 Search results for “Havering” – Compare school and college performance data in England – GOV.UK See also Havering’s Secondary Academies: Their Progress 8 Rankings, 2024 – Politics in Havering

2 Abbs Cross Academy and Arts College – Compare school and college performance data in England – GOV.UK Grade 5+ English and Maths is a Gold Standard acting as an entry point for many post 16 opportunities

3 Abbs Cross Academy and Arts College – Open – Find an Inspection Report – Ofsted

4 Results by pupil characteristics – Marshalls Park Academy – Compare school and college performance data in England – GOV.UK

Havering’s Secondary Academies: Their Progress 8 Rankings, 2024

The government’s performance analysis1 creates a ‘level playing field’ for comparisons. The government’s Progress 8score is their tool of analysis. This is,

“The academic progress that pupils make from the end of key stage 2 to the end of key stage 4. This is based on 8 qualifications.”

Progress 8 predicts GCSE results based on a statistical analysis of KS2. KS2 results are an effective tool, which generates GCSE profiles for a school’s intake. The government uses five categories -Well Above Average, Above Average, Average, Below Average and Well Below Average.

A high Progress 8 score isn’t correlated with GCSE results. It is based on ‘Added Value’ that a school gives to their students. For example, Sacred Heart of Mary has a higher ranking than Coopers Coburn despite their GCSE results being similar. The higher ranking of Sacred Heart is because their 2019 intake had lower KS2 outcomes than Coopers. This implies Sacred Heart add more ‘value’ than Coopers.

Progress 8 doesn’t predict what any particular student will do. Students in every category of school will under, or over, achieve. Progress 8 is a statement about a school’s performance in general.

Well Above Average2

Sacred Heart of Mary, Campion and Harris Academy Rainham

Above Average

Royal Liberty, Coopers Coburn, Frances Bardsley, Hall Mead, Redden Court and Hornchurch High

Average

Gaynes, St Edward’s and Drapers’

Below Average

Abbs Cross, Emerson Park, Marshalls Park, Brittons and Sanders Draper

Well Below Average

Bower Park

Notes

  1. Search results for “Havering” – Compare school and college performance data in England – GOV.UK
  2. This list is in ranking order. Therefore, Sacred Heart is the highest-ranking school in the category ‘Well Above Average’. Likewise Royal Liberty, Gaynes and Abbs Cross in their categories

Havering’s Academies On Parade: Choose Me!

In the 1950s children attended their nearest secondary school and four years later they left. They started work the following Monday. And that was that.

It’s more complex nowadays. Schools are expected to be attractive and parents must choose a school. How? Choosing implies knowledge. Diligent parents do research, read OFSTED reports, scrutinise school’s web pages and attend Open Evenings.

Good GCSE results are a selling point for some parents. But what if the school isn’t a stellar performer? What happens then?

They shamelessly duck and dive.

St. Edwards Academy have an out-of-date ‘Performance and Results’ page. This is supported by the government performance website, which tells the reader that the school’s grade is ‘Well above average’.2 Expertise is needed to understand the website. The 2022 OFSTED report, which is readable, is good.3

Meanwhile Marshalls Park Academy is, “…incredibly proud of all students….and our 2024 results include many notable success stories.”3 They follow up with a link to the government website.4 Its banding is, “Well Below Average”.5 Nonetheless the school reaches the national ‘Gold Standard’ GCSE English and Maths grade 5.6

Coopers Coburn,8 Drapers Academy9 and Harris Academy Rainham10 publish exam results in full. Parents, who care about GCSE results, know exactly where they stand. There’s no ambiguity.

GCSE results aren’t commercial secrets, which need protecting. They’re part of the way in which parents chose a school for their child.

Addendum: Research note

This was written on the 27th October 2024. The schools quoted are a sample of the 18 academies in Havering. This topic is discussed in more detail here.11

Notes

1 Performance & Results | St Edward’s Church of England Academy

2 St Edward’s Church of England Academy – Compare school and college performance data in England – GOV.UK A dedicated parent would look at this table Download data – Compare school and college performance data in England – GOV.UK

3 St Edward’s Church of England Academy – Open – Find an Inspection Report – Ofsted

4 Marshalls Park Academy – Exam Results It continues, “Our two top performing students were Ralph Gilroy and Caoimhe Juson, with an impressive 16 grade 8 and 9’s between them.” The misplaced apostrophe is unfortunate in this context

5 Marshalls Park Academy – Compare school and college performance data in England – GOV.UK

6 loc.cit. This relates to 2023. It’s included because the school directed the reader to it.

7 loc.cit.

8 GCSE-Examination-Results-2024.pdf

9 Headline-Results-2024-main.pdf

10 Examinations Results – Harris Academy Rainham

11 How Havering’s Academies Conceal their 2022 GCSE Results – Politics in Havering NB Harris Academy have changed their presentation of results since 2022 and are now an example of best practice.

Havering and the Loxford School Trust

Abbs Cross and Gaynes Academies are owned by Loxford Schools Trust, Ilford. Loxford school is ‘outstanding’. Their Leadership Team believe they can transfer their successful formula. They now own five secondary academies.1

Academies are government funded businesses with Loxford receiving £50m.2 The twelve person leadership team, earn between £100,000 and £250,000. (Their CEO earns £54,000 more than Havering’s chief executive.) Stellar salaries demand consistent stellar performance. Their principal challenge is under-achievement of Disadvantaged Students.3

The Gold Standard: Grade 5 GCSE in English and Mathematics

The national outcome for disadvantaged students is 25.2% Gold Standard successes. For non-disadvantaged students the national outcome is 45.2%. This huge gap must be bridged to be rated excellent. Loxford School is excellent. Their disadvantaged students achieved 56% for the Gold Standard. Loxford’s disadvantaged students beat the national outcome in both categories. An outstanding performance.

It’s a different story in Havering.

Abbs Cross Academy: 23% of their disadvantaged students achieved the Gold Standard.4

Gaynes Academy: 33% of their disadvantaged students achieved the Gold Standard.5

Neither come close to Loxford’s result. Nor do they come close to the national 45.2% for non-disadvantaged students. Loxford’s Havering schools haven’t closed the Attainment Gap.

Havering, in general, has significant problems with under-achievement by disadvantaged students. Only four schools out of 18 reach 45.2% with their disadvantaged students. Loxford massively exceeded the national outcome with their disadvantaged students.

Conclusion

Loxford Schools Trust have failed. Four of their six secondary academies are below the all-student Gold Standard. Tabor Academy is catastrophically below that standard. They should be humble and recognise their stunning success in inner-city Ilford hasn’t travelled well.

Addendum: Loxford’s other academies and their Gold Standard outcomes

Warren Academy

49% for disadvantaged students, which is above the national outcome for all students. Barking and Dagenham’s non-disadvantaged students achieved 54%. 6

Tabor Academy

15% for disadvantaged students. This is catastrophic and demands action from the *stellar* Leadership Team in Ilford. Essex’s non-disadvantaged students achieved 49%. 7

Cecil Jones Academy

25% for disadvantaged students, which is the national average. Southend’s non-disadvantaged students achieved a stunning 66%. 8

Notes

1 Governance Profiles – Loxford School Trust

2 LOXFORD 2023ACCSWIZ.cvw (loxfordtrust.s3.amazonaws.com)  see p71

3 Key stage 4 performance, Academic year 2022/23 – Explore education statistics – GOV.UK (explore-education-statistics.service.gov.uk) Table 8 is an excellent summary

4 Results by pupil characteristics – Abbs Cross Academy and Arts College – Compare school and college performance data in England – GOV.UK (compare-school-performance.service.gov.uk) See also Havering’s GCSE Attainment Gap, 2023 – Politics in Havering

5 Results by pupil characteristics – Gaynes School – Compare school and college performance data in England – GOV.UK (compare-school-performance.service.gov.uk)

6 Results by pupil characteristics – The Warren School – Compare school and college performance data in England – GOV.UK (compare-school-performance.service.gov.uk)

7 Results by pupil characteristics – Tabor Academy – Compare school and college performance data in England – GOV.UK (compare-school-performance.service.gov.uk)

8 Results by pupil characteristics – Cecil Jones Academy – Compare school and college performance data in England – GOV.UK (compare-school-performance.service.gov.uk)

Havering’s People Overview and Scrutiny Committee, 5th March, 2024 (part two)

This agenda included a Housing item and the School Performance analysis. The latter is the focus of this blog.

Matt Stanton (1 hour47)1 expressed concerns about how wide the variations in achievement between schools are. He asked the Director what was needed to rectify this problem. Trevor Cook replied ‘Context’ was needed to understand the issue. This is pivotal as it implies underachievement is inevitable. It chimed with remarks about fortunate authorities who suffered less from Covid-19 and had superior funding.

Praising Hall Mead and Redden Court damaged his argument. In 2019 both were below average.2 They’re now average. This happened during five challenging years. Their performance has improved in the Covid-19 and Funding Crisis years.

The 2019 list of eleven below average schools has reduced to six in 2024.4 Emerson Park has dropped into the ‘below average’ group since 2019. A third of Havering’s secondary schools are below average (6 out of 12) and five schools left the 2019 list.

Matt’s concerns were echoed by Frankie Walker, Mandy Anderson and Judith Holt. Judith believed every Havering school should be above average. She refuted Trevor Cook’s response about Covid-19 and Funding. Her actual doubts related to whether his explanations were correlation or causation. All of Havering’s schools share the same challenges but nonetheless there are massive differences in outcomes.

Trevor Cook is soothing. However, members were in a combative mood looking for action. Some academies are successful but others are weak. A third of Havering’s schools are below average, which is far too many.

Notes

1 Agenda for People Overview & Scrutiny Sub Committee on Tuesday, 5th March, 2024, 7.00 pm | The London Borough Of Havering Go to webcast and then to one hour 47 for the beginning of his contribution

2 Havering and Redbridge: A Tale of Two Boroughs – Politics in Havering 29th Nov 2019

3 All schools and colleges in Havering – Compare school and college performance data in England – GOV.UK (compare-school-performance.service.gov.uk) This gives the current status of every school in Havering.

4 Schools leaving the 2019 list are Abbs Cross, Hornchurch High, Royal Liberty, Redden Court and Hall Mead

Havering, Barking and Dagenham and The Attainment Gap, 2023

Providing great schooling is the single most important thing we can do to help any child from a disadvantaged background succeed. It’s also the single most important thing we can do to boost the long-term productivity of our economy George Osborne’s Budget speech in full (ft.com) 2016

Education is the, “single most important thing” (see above) for disadvantaged students and the national economy. George Osborne funded the Pupil Premium (PP), which, in 2023, had a £2.9bn budget as an investment.1 Schools are allocated £1,035 per student from PP funds. They are expected to close the attainment gap because it is a negative in human and economic terms.

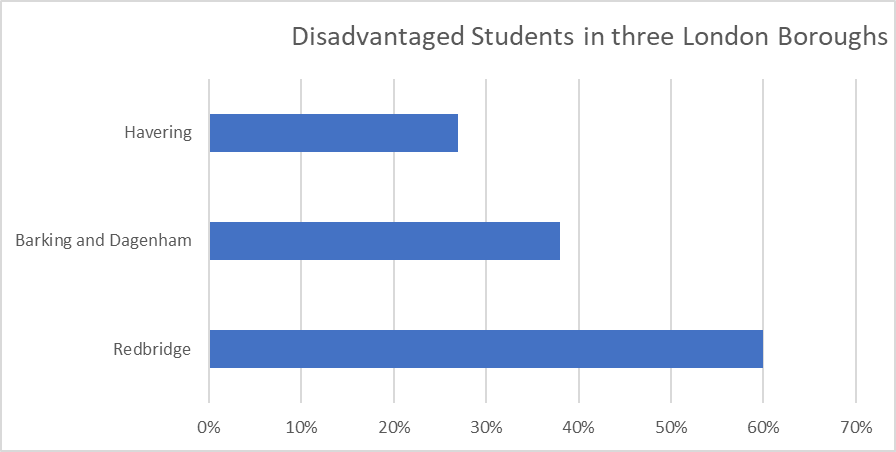
The ‘attainment gap’ is based on failing to achieve Grade 5 GCSE in English and Maths because of poverty. It is used by the government in their analysis of results.2 There are shocking variations between boroughs in their achievement. Students in Redbridge are more than twice as likely to get the Gold Standard as those in Havering.3 (see graph below)

Barking and Dagenham is the fifth most deprived borough in England4 whilst its neighbour Havering is prosperous. Many schools have a successful learning environment for disadvantaged students. Other schools, apparently, expect them to fail by not meeting their needs.

Havering’s 653 Year 11 disadvantaged students in 2023 achieved a ‘Gold Standard’5 pass rate of 27%. Barking and Dagenham’s 939 disadvantaged students achieved a 38% pass rate. Eleven percentage points is a chasm. If Havering’s schools matched Barking and Dagenham’s, the success rate would soar. Put simply, it equates to an additional 68 passes for Havering’s Year 11s in 2023.

All of Havering’s schools are academies who are accountable for these disastrous results. The academies are entirely responsible for educational outcomes.

Notes

1 SN06700.pdf (parliament.uk)

2 Compare the performance of schools and colleges in England – GOV.UK (www.gov.uk) This is an invaluable resource and is relatively straight-forward.

3 Havering’s GCSE Attainment Gap, 2023 – Politics in Havering  See also Havering and Redbridge’s Disadvantaged Secondary Students – Politics in Havering  ‘Gold Standard’ as it is a principal gateway qualification post-16

4 IoD2019_Statistical_Release.pdf (publishing.service.gov.uk) See especially map 2 on p12


Havering’s GCSE Attainment Gap, 2023

GCSE Grade 5 English and Maths is as crucial for disadvantaged students as for all other youngsters. Unfortunately, disadvantaged students do so badly in some schools, it’s as if they’re victims of a conspiracy.1

The Gold Standard for GCSE is ‘Grade 5 English and Maths’. This is the benchmark used to define the attainment gap. It’s ‘Gold’ because it impacts on post-16 opportunities where success is a game changer. Regardless of the excellence of other GCSE results students must have Grade 5 English and Maths to progress to ‘A’ level for example.


St Edwards is the only Havering school with a level playing field for disadvantaged students.

The Human Cost

In 2023, 653 disadvantaged students sat GCSE. The national success result for all students is 45.3%.2 This benchmark means 295 disadvantaged students should have achieved the Gold Standard in Havering. Their actual results are 175 Gold Standard passes (27%). 120 students were denied many post-16 opportunities because their school didn’t level-up the achievement gap by using government funds efficiently.

(If St Edwards is used as the benchmark, Havering’s attainment gap increases to 151 students.)

Government funding for disadvantaged students

Schools with disadvantaged students receive £1,035 per student Pupil Premium (PP) funding. ‘Disadvantaged’ means receiving ‘Free School Meals’ or being ‘Looked After’. The money is paid directly to schools as they’re trusted to use the funds wisely and ‘level-up’ achievement.3 The minimum the government paid Havering’s 18 schools for Year 11s, 2022-3, is £678,249. Most of that funding wasn’t used efficiently as can be seen from the table above.

The Attainment Gap: Marshalls Park and Emerson Park

Both schools achieved 45% ’Gold Standard’ results for students in general but utterly failed disadvantaged students with a ‘success’ rate of 16% and 17% respectively.  

  • Emerson Park don’t publish exam results but state, “Emerson Park Academy is, once again, celebrating an outstanding set of GCSE results.” (my emphasis)
  • Marshalls Park don’t publish their results either. They say, “We believe that we provide an academic education, that is grounded in strong literacy and numeracy….” (my emphasis)3

The government’s PP funding stream for Year 11 disadvantaged students is £46,575 for Marshalls Park and £48,645 for Emerson Park. Neither the government or Year 11 disadvantaged students got ‘value-for-money’. It’s clear PP funding isn’t used to the best effect. Both schools have strategies which need an urgent revisit with external experts.

The Attainment Gap: OFSTED

The attainment gap is not discussed in OFSTED reports nor is the use of Pupil Premium funding.4

Notes

1 The-Forgotten-Third-Interim-Report-March-2019.pdf (ascl.org.uk) This research focuses on Grade 4 and is less than what is used for this discussion. Grade 4 is an entry level qualification and is discounted for ‘A’ level courses.

2 Key stage 4 performance, Academic year 2022/23 – Explore education statistics – GOV.UK (explore-education-statistics.service.gov.uk)

3 Emerson Park Academy – A message from Mr McGuinness regarding GCSE Results This relates to 2022 there is nothing for 2023 even though the data was accessed February 2024. See also Marshalls (marshallspark.org.uk)

4 Marshalls Park 50148108 (ofsted.gov.uk) See also Emerson Park 50193985 (ofsted.gov.uk)


.


Why isn’t there a Standard Format for the publication of GCSE results?

Havering doesn’t have a standard format for publishing GCSE results.1 As a result they’re difficult to interpret. Havering’s schools aren’t alone;

Woodford County High, Redbridge2

No of Year 11 pupils 178
No of GCSE entries 1754
% of levels 9 – 7 (equivalent to A*+ A Grades ) 80%
% of levels 9 32%
% of pupils achieving 5+ levels 9-5 100%
% of pupils achieving 5+A*-C levels 9-5 including English & Maths 99%
% of students attaining English Baccalaureate 97%

There’s little detail – does the school have any weak subject areas? – but what is published is intelligible.

Hornchurch High School3

This school offers time-lapsed results from 2022, even though the 2023 results came out in late August ’23.

Performance Measure
Progress 8 Score -0.42
Attainment 8 Score 45.4
% pupils achieving a grade 5 or above in GCSE English and maths 40
% pupils entering the English Baccalaureate (EBacc) 72
English Baccalaureate Average Points Score 4.22
% of pupils staying in education or employment after KS4 88

Who this set of statistics is for is unclear. Current information can be found on the government website4 – which the school identifies. That website is full of statistical detail, which might not suit everyone.

Abbs Cross Academy5
They offer 2023 results without mentioning subject areas beyond an English and Maths analysis. They offer a link to the government’s website for a league table.6 (They are average.)

Sacred Heart of Mary
Meanwhile Havering’s top performing school,7 shows what should done and provides a template for every school in Havering. Every subject is listed with the outcomes and the number of pupils who sat each examination.

Conclusion

There’s no acceptable explanation why Havering’s schools conceal examination results from parents and taxpayers. Last year this blog wrote about the same issue and ONE school immediately took action. Schools should understand that the publication of results is in their interests. This is especially the case in an era of conspiracy theorists.

Notes

1 How Havering’s Academies Conceal their 2022 GCSE Results – Politics in Havering

2 Woodford County High School For Girls – 2023 Exam Results

3 Hornchurch High School » EXAMINATION PERFORMANCE, 2021-22

4 Secondary – Hornchurch High School – Compare school and college performance data in England – GOV.UK (compare-school-performance.service.gov.uk)

5 Achievement And Performance – Abbs Cross Academy The school’s analysis of English and Maths is very technical and beyond most non-educator’s understanding. Effectively it’s meaningless for most parents.

6 All schools and colleges in Havering – Compare school and college performance data in England – GOV.UK (compare-school-performance.service.gov.uk)

7 GCSE-RESULTS-SUMMER-2023-v3.pdf (realsmart.co.uk)