Drapers’ Academy and Disadvantaged Students

[Nationally] 25.2% of disadvantaged pupils and 52.4% of all other pupils got a grade 5 or above  [in GCSE English and Maths]1

Drapers’ Academy should be experts in educating disadvantaged students. In 2024 they entered 89 disadvantaged students for GCSE. They have a critical mass enabling the school to pivot teaching to their needs. Achieving Gold Standard GCSEs, which are Grade 5+ for English and Maths, for the disadvantaged demands robust strategies. Poverty doesn’t cause the under-achievement of disadvantaged children but there’s a correlation.2

Drapers’, in 2024, beat the national average. Their disadvantaged students achieved 28.1% Gold Standard.

Drapers’ Academy is managed by Queen Mary University, London. A university management trust should utilise their research expertise with GCSE results. They’re a diagnostic tool for research. Once data is analysed they can recommend the best strategies for improving outcomes.

St Edward’s Academy, Romford3 actively research the achievement of the disadvantaged. (see Addendum two) In 2024 they achieved significantly superior4 results to Drapers’. If replicated at Drapers’, seven extra Gold Standard successes would have occurred.

The government’s 2024 Pupil Premium payment for Year 11 at Drapers’ was a minimum of £93,450.5 Did that £93K raise standards? Drapers’ are committed to Bronfenbrenner’s Ecological Model of Child Development.6 GCSE results in 2024 didn’t endorse its insights.

Drapers’ had 89 students facing significant challenges in 2024. They have huge amounts of Pupil Premium funding, an academic management team and a desire to succeed. If St Edward’s can do it why not Drapers’?

Addendum One: Drapers’ Academy, Chair of Governors

Oliver Everett is a Liveryman of the Drapers’ Company. He is a farmer and a consultant specialising in the link between the private sector and government, working extensively in Africa. Outside work, he is an Entrepreneur Mentor in Residence at London Business School.

Addendum Two: St Edward’s and their access to research

Having Unity Research School as part of Unity Schools Partnership means that Unity’s schools have instant access to evidence-based information which they can use in the classroom to improve outcomes for pupils, particularly those from disadvantaged backgrounds. In an age of over-whelming amounts of pseudo-evidence, Unity Research School provides a solid and trustworthy source of information, proven to work in school settings and can help each school apply the evidence so that it is relevant to their setting and pupils’ needs.7

Notes

1 Attainment at age 16 – Social Mobility Commission State of the Nation – GOV.UK

2 https://dictionary.cambridge.org/dictionary/english/correlation

3 Results by pupil characteristics – St Edward’s Church of England Academy – Compare school and college performance data in England – GOV.UK They aren’t a privileged school. 36% of their students in 2024 were disadvantaged. Coopers Coburn had 5% disadvantaged students who achieved three Gold Standard passes.

4 Seven doesn’t look much but it is 28.5 percentage points greater.

5 The 89 students would have generated several hundred thousand pounds of Pupil Premium funding over their five years at the school

6 Pupil Premium – Drapers’ Academy

7 Unity Research School | Unity Schools Partnership

Havering’s Secondary Schools: Two Government Assessments

Havering’s schools have two forms of government assessment. Firstly, Progress 8 predicts GCSE results by using a statistical analysis of KS2. Schools which add value  means children will out-perform their expected grades. Secondly, OFSTED reports. They happen at multi-year intervals. Inspectors grade schools using five headings, (1) Overall effectiveness, (2) Effectiveness of leadership and management, (3) Quality of teaching, learning and assessment, (4) Personal development, behaviour and welfare and (5) Outcomes for pupils.

Progress 8

Well Above Average1

Sacred Heart of Mary, Campion and Harris Academy Rainham

Above Average

Royal Liberty, Coopers Coborn, Frances Bardsley, Hall Mead, Redden Court and Hornchurch High

Average

Gaynes, St Edward’s and Drapers’

Below Average

Abbs Cross, Emerson Park, Marshalls Park, Brittons and Sanders Draper

Well Below Average

Bower Park

OFSTED

OFSTED uses four summary categories Outstanding, Good, Requires Improvement and Inadequate. Reports aren’t annual and not necessarily current.

Outstanding

Hall Mead, Redden Court, Sacred Heart of Mary, Francis Bardsley (3 categories out of 5), and Royal Liberty (short inspection)

Good

Every other school.

Discussion

There’s no correlation between the two government assessments.

OFSTED criteria, Quality of teaching, learning and assessment and Outcomes for pupils are critical for every stakeholder using the reports.

How can a 22% GCSE Grade 5+ English and Maths pass rate for disadvantaged children at Abbs Cross2 be rewarded by a ‘Good’ assessment. OFSTED say, Trustees, leaders and staff have high expectations for all pupils, including those with special educational needs and/or disabilities (SEND). (my emphasis). ‘High expectations’ in this context is overblown.

Likewise, Marshalls Park. 42.1% non-disadvantaged children passed Grade 5+ English and Maths and are rated ‘Good’. This result is 5% below the national average and 10% below the Havering comparator. Worse: disadvantaged children achieved a sickening 21.8%4 English and Maths Gold Standard pass rate at Marshalls Park.

OFSTED reports aren’t fit for purpose. Their reports lack rigour and ignore outcomes which are important to society. Progress 8 focuses on added value, whichschools create. OFSTED ignores these insights. This is a criminal dereliction of duty.

Notes

1 Search results for “Havering” – Compare school and college performance data in England – GOV.UK See also Havering’s Secondary Academies: Their Progress 8 Rankings, 2024 – Politics in Havering

2 Abbs Cross Academy and Arts College – Compare school and college performance data in England – GOV.UK Grade 5+ English and Maths is a Gold Standard acting as an entry point for many post 16 opportunities

3 Abbs Cross Academy and Arts College – Open – Find an Inspection Report – Ofsted

4 Results by pupil characteristics – Marshalls Park Academy – Compare school and college performance data in England – GOV.UK

Havering and the Loxford School Trust

Abbs Cross and Gaynes Academies are owned by Loxford Schools Trust, Ilford. Loxford school is ‘outstanding’. Their Leadership Team believe they can transfer their successful formula. They now own five secondary academies.1

Academies are government funded businesses with Loxford receiving £50m.2 The twelve person leadership team, earn between £100,000 and £250,000. (Their CEO earns £54,000 more than Havering’s chief executive.) Stellar salaries demand consistent stellar performance. Their principal challenge is under-achievement of Disadvantaged Students.3

The Gold Standard: Grade 5 GCSE in English and Mathematics

The national outcome for disadvantaged students is 25.2% Gold Standard successes. For non-disadvantaged students the national outcome is 45.2%. This huge gap must be bridged to be rated excellent. Loxford School is excellent. Their disadvantaged students achieved 56% for the Gold Standard. Loxford’s disadvantaged students beat the national outcome in both categories. An outstanding performance.

It’s a different story in Havering.

Abbs Cross Academy: 23% of their disadvantaged students achieved the Gold Standard.4

Gaynes Academy: 33% of their disadvantaged students achieved the Gold Standard.5

Neither come close to Loxford’s result. Nor do they come close to the national 45.2% for non-disadvantaged students. Loxford’s Havering schools haven’t closed the Attainment Gap.

Havering, in general, has significant problems with under-achievement by disadvantaged students. Only four schools out of 18 reach 45.2% with their disadvantaged students. Loxford massively exceeded the national outcome with their disadvantaged students.

Conclusion

Loxford Schools Trust have failed. Four of their six secondary academies are below the all-student Gold Standard. Tabor Academy is catastrophically below that standard. They should be humble and recognise their stunning success in inner-city Ilford hasn’t travelled well.

Addendum: Loxford’s other academies and their Gold Standard outcomes

Warren Academy

49% for disadvantaged students, which is above the national outcome for all students. Barking and Dagenham’s non-disadvantaged students achieved 54%. 6

Tabor Academy

15% for disadvantaged students. This is catastrophic and demands action from the *stellar* Leadership Team in Ilford. Essex’s non-disadvantaged students achieved 49%. 7

Cecil Jones Academy

25% for disadvantaged students, which is the national average. Southend’s non-disadvantaged students achieved a stunning 66%. 8

Notes

1 Governance Profiles – Loxford School Trust

2 LOXFORD 2023ACCSWIZ.cvw (loxfordtrust.s3.amazonaws.com)  see p71

3 Key stage 4 performance, Academic year 2022/23 – Explore education statistics – GOV.UK (explore-education-statistics.service.gov.uk) Table 8 is an excellent summary

4 Results by pupil characteristics – Abbs Cross Academy and Arts College – Compare school and college performance data in England – GOV.UK (compare-school-performance.service.gov.uk) See also Havering’s GCSE Attainment Gap, 2023 – Politics in Havering

5 Results by pupil characteristics – Gaynes School – Compare school and college performance data in England – GOV.UK (compare-school-performance.service.gov.uk)

6 Results by pupil characteristics – The Warren School – Compare school and college performance data in England – GOV.UK (compare-school-performance.service.gov.uk)

7 Results by pupil characteristics – Tabor Academy – Compare school and college performance data in England – GOV.UK (compare-school-performance.service.gov.uk)

8 Results by pupil characteristics – Cecil Jones Academy – Compare school and college performance data in England – GOV.UK (compare-school-performance.service.gov.uk)

Havering’s GCSE Attainment Gap, 2023

GCSE Grade 5 English and Maths is as crucial for disadvantaged students as for all other youngsters. Unfortunately, disadvantaged students do so badly in some schools, it’s as if they’re victims of a conspiracy.1

The Gold Standard for GCSE is ‘Grade 5 English and Maths’. This is the benchmark used to define the attainment gap. It’s ‘Gold’ because it impacts on post-16 opportunities where success is a game changer. Regardless of the excellence of other GCSE results students must have Grade 5 English and Maths to progress to ‘A’ level for example.


St Edwards is the only Havering school with a level playing field for disadvantaged students.

The Human Cost

In 2023, 653 disadvantaged students sat GCSE. The national success result for all students is 45.3%.2 This benchmark means 295 disadvantaged students should have achieved the Gold Standard in Havering. Their actual results are 175 Gold Standard passes (27%). 120 students were denied many post-16 opportunities because their school didn’t level-up the achievement gap by using government funds efficiently.

(If St Edwards is used as the benchmark, Havering’s attainment gap increases to 151 students.)

Government funding for disadvantaged students

Schools with disadvantaged students receive £1,035 per student Pupil Premium (PP) funding. ‘Disadvantaged’ means receiving ‘Free School Meals’ or being ‘Looked After’. The money is paid directly to schools as they’re trusted to use the funds wisely and ‘level-up’ achievement.3 The minimum the government paid Havering’s 18 schools for Year 11s, 2022-3, is £678,249. Most of that funding wasn’t used efficiently as can be seen from the table above.

The Attainment Gap: Marshalls Park and Emerson Park

Both schools achieved 45% ’Gold Standard’ results for students in general but utterly failed disadvantaged students with a ‘success’ rate of 16% and 17% respectively.  

  • Emerson Park don’t publish exam results but state, “Emerson Park Academy is, once again, celebrating an outstanding set of GCSE results.” (my emphasis)
  • Marshalls Park don’t publish their results either. They say, “We believe that we provide an academic education, that is grounded in strong literacy and numeracy….” (my emphasis)3

The government’s PP funding stream for Year 11 disadvantaged students is £46,575 for Marshalls Park and £48,645 for Emerson Park. Neither the government or Year 11 disadvantaged students got ‘value-for-money’. It’s clear PP funding isn’t used to the best effect. Both schools have strategies which need an urgent revisit with external experts.

The Attainment Gap: OFSTED

The attainment gap is not discussed in OFSTED reports nor is the use of Pupil Premium funding.4

Notes

1 The-Forgotten-Third-Interim-Report-March-2019.pdf (ascl.org.uk) This research focuses on Grade 4 and is less than what is used for this discussion. Grade 4 is an entry level qualification and is discounted for ‘A’ level courses.

2 Key stage 4 performance, Academic year 2022/23 – Explore education statistics – GOV.UK (explore-education-statistics.service.gov.uk)

3 Emerson Park Academy – A message from Mr McGuinness regarding GCSE Results This relates to 2022 there is nothing for 2023 even though the data was accessed February 2024. See also Marshalls (marshallspark.org.uk)

4 Marshalls Park 50148108 (ofsted.gov.uk) See also Emerson Park 50193985 (ofsted.gov.uk)


.


Havering and Redbridge’s Disadvantaged Secondary Students

‘Closing the attainment gap between disadvantaged children and their peers is the greatest challenge facing English schools. The gap is stubborn because its causes are entrenched and complex, and most lie beyond the control of schools and educators. However, it is clear that schools can make a difference.1

Havering and Redbridge have 18 secondary schools each. Redbridge’s disadvantaged students do markedly better than those in Havering (see Addendum).

Schools receive additional funding through the Pupil Premium (PP) to try to alleviate the challenges disadvantaged students face. PP funding is a flat rate for eligible students.

Marshalls Park, Havering, PP £232,245

The most recent examination results were published in 2019. The academy said their students achieved “…amazing results, some of the best the school has ever had.”    Their disadvantaged students achieved a catastrophic success rate of 18% at GCSE grade 5+ English and Mathematics.

Chadwell Heath, Redbridge, PP £241,230

They said, “This year [2019] our pupils have produced our best ever set of examination results.” Their disadvantaged students achieved 44% grade 5+ English and Mathematics. Chadwell Heath really has ‘Levelled-up’ giving their students a platform for ‘A’ levels post-16.

Discussion

The introductory quote neatly summarises the challenges presented by disadvantaged students. Marshalls Park focuses on, “The [attainment] gap is stubborn because its causes are entrenched and complex, and most lie beyond the control of schools and educators.”  In brief, school leaders work on the theory that the attainment gap is intractable, whereas Chadwell Heath has taken heart from, “However, it is clear that schools can make a difference,” and plan accordingly.

These two sentences sum up senior management responses. Schools which undervalue disadvantaged students hamper their achievement. This is revealed in the GCSE results for the two schools. Disadvantaged students are challenging but PP funding aids skillful management offering an empathetic response. It’s clear that schools that meet the challenge are rewarded with higher achievement for every student.4

Addendum


Notes

1 PP-Strategy-and-Costs-Reviewed-2020-21.odt (live.com)

2 Exam Results | Marshalls Park Academy  Marshalls Park Academy  for government statistics see- GOV.UK – Find and compare schools in England (compare-school-performance.service.gov.uk) For a general look at the way that Havering schools are mediocre see Havering’s Academy Schools: Councillor Robert Benham’s Dilemma – Politics in Havering

3 Chadwell Heath Academy – Exam results (chadwellacademy.org.uk)

4 Chadwell Heath’s students at grade 5+ English and Mathematics achieved 61%: Marshalls Park 46%.

Havering’s Secondary Academies and their Disadvantaged Students

Research:

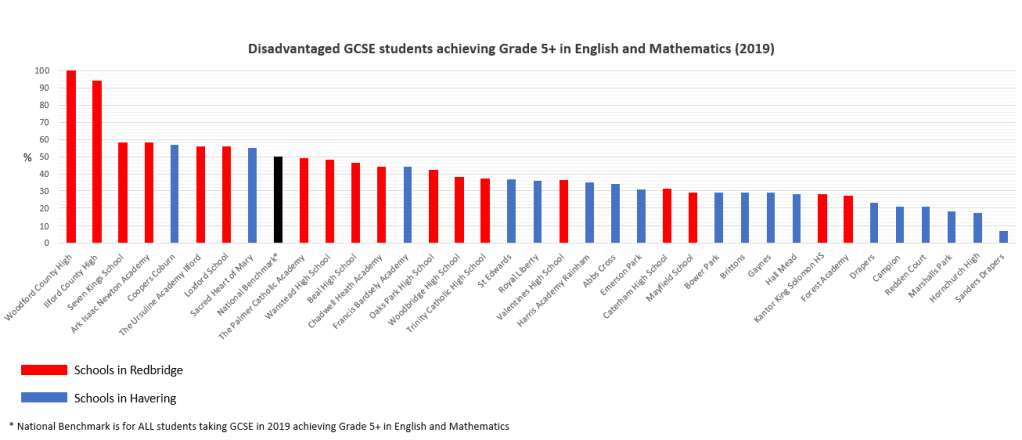
The key metric is the Gold Standard of GCSE Grade 5+ English and Mathematics. For England, non-disadvantaged students’ outcome is 50%. Havering out-performs England by a significant 5 percentage points.

The 2019 statistics are from the government website1 (see Addendum). The benchmark is 50%.

PP = Pupil Premium this is additional funding for closing the attainment gap of disadvantaged students. A higher figure indicates a greater number of disadvantaged students in the school as it’s a per capita payment. Total PP funding for Havering’s secondary academies is £3,578,103

Coopers Coburn

English and Mathematics Grade 5+ Disadvantaged 57% PP £87,450

Sacred Heart of Mary

English and Mathematics Grade 5+ Disadvantaged 55% PP £137,889

Francis Bardsley

English and Mathematics Grade 5+ Disadvantaged 44% PP £216,440

St Edwards

English and Mathematics Grade 5+ Disadvantaged 37% PP £188,182

They tacitly blame their students by saying that “33%  [of] St Edward’s students live in Barking and Dagenham (ranked fifth most deprived local authority in England).

See Pupil-Premium-Report-2020-2021-md.pdf (steds.org.uk)

Royal Liberty

English and Mathematics Grade 5+ Disadvantaged 36% PP £143,250

Harris Academy Rainham

English and Mathematics Grade 5+ Disadvantaged 35% PP £230,000 (approximately)

They arrogantly don’t give an accurate figure for their PP funding.

Abbs Cross

English and Mathematics Grade 5+ Disadvantaged 34% PP £153,340

Emerson Park

English and Mathematics Grade 5+ Disadvantaged 31% PP £218,005

Bower Park

English and Mathematics Grade 5+ Disadvantaged 29% PP £275,995

Brittons

English and Mathematics Grade 5+ Disadvantaged 29% PP £265,985

Gaynes2

English and Mathematics Grade 5+ Disadvantaged 29% PP £69,100

Hall Mead

English and Mathematics Grade 5+ Disadvantaged 28% PP £166,309

Drapers

English and Mathematics Grade 5+ Disadvantaged 23% PP £384,640

Campion

English and Mathematics Grade 5+ Disadvantaged 21% PP £67,675

Redden Court3

English and Mathematics Grade 5+ Disadvantaged 21%1 PP £157,685

A significant proportion of students at Redden Court School (c.25%) are disadvantaged. We never use this as an excuse; rather, it adds to our moral purpose. Our school motto is: ‘Committed to Success for All’; this is something we strongly believe in – we are, therefore, committed to the success of all our disadvantaged students.”

Pupil Premium Strategy 2020/21 – Google Docs

Marshalls Park

English and Mathematics Grade 5+ Disadvantaged 18% PP £232,245

Hornchurch High2

English and Mathematics Grade 5+ Disadvantaged 17% PP £367,218

Sanders Drapers

English and Mathematics Grade 5+ Disadvantaged 7% PP £216,785

Discussion

As both the 2020 and 2021 GCSE examinations are unnoticed on government, and usually, school websites, drawing conclusions is tricky. For example there’s a new management team at Sanders Draper Academy and schools aren’t static places. Nonetheless some broad brush statements can be made.

Correlation is poor between PP funding and outcomes. St Edwards is 10th in Havering’s PP funding rankings but 4th in outcomes for disadvantaged students. Meanwhile Marshalls Park is 5th in PP funding and 15th in outcomes.

Three average schools in Havering at co-equal 9th

Bower Park’s 2018 OFSTED inspection rated the school as ‘Good’ in Bower Park’s case a third of disadvantaged students (49/147) are discounted as their outcomes are less than good.

Brittons 2019 examination results show that 30% of their cohort achieved the Gold Standard, which is virtually identical to those of disadvantaged students. So they are below the borough average for non-disadvantaged students but average for disadvantaged students.

Gaynes has a solid performance of 60% in English and Mathematics for the school5 but that isn’t translated to disadvantaged students. Their statistics are affected by the small numbers in the cohort where a single student can be disproportionate.

Addendum: Covid-19 and GCSE results

Both the 2020 and 2021 GCSE examinations were teacher assessed. It’s immediately apparent that those results aren’t used in a customary way. The government website doesn’t use them and most schools publish a summary. Why? Are these GCSE results problematic? Are they fatally flawed and a pale imitation of the real thing? This places a constraint on understanding current, 2021, outcomes for disadvantaged students.

Notes

1 GOV.UK – Find and compare schools in England (compare-school-performance.service.gov.uk)

2 These blogs were written some time ago and it was at that point I decided to review every secondary school in Havering. Gaynes School Gaynes School, the Pupil Premium and Accountability – Politics in Havering and Hornchurch High School Hornchurch High School, the Pupil Premium and Accountability – Politics in Havering

3 Ofsted: Redden Court School could be ‘outstanding’ | Romford Recorder

4 2771545 (ofsted.gov.uk) Bower Park is at Havering’s average along with Brittons and Gaynes at joint 9th out of 18.

5 All schools and colleges in Havering – GOV.UK – Find and compare schools in England (compare-school-performance.service.gov.uk) See also Achievement and Performance – Gaynes School